All of this generates plenty of fodder for newspaper headlines, public relations campaigns, and resume bullet points, but at the end of the day it makes it tough to separate the wheat from the chaff. What’s real and what’s noise? Each district and school will have a different answer. For Atlanta Public Schools, the answer is that neither achievement nor graduation has moved in very meaningful ways in recent years.
Achievement
Following the cheating scandal, scores in APS dropped as cheating teachers were fired and exams returned to reflecting true student learning. Since 2011 though, not much has changed.
Because tests are harder in some grades/subjects than others and the Milestones have a different average score than the CRCT, it is helpful to report scores on a consistent basis when comparing one year to the next. One way to do this is to report scores in terms of how many years ahead or behind they suggest a district is.[1]
Back in 2011, APS students were about 0.62 grades behind the average student in the state.[2] In 2016, they were about 0.69 grades behind. Not much has changed. The graph below shows how EOGT scores for Georgia districts have moved over the past five years.
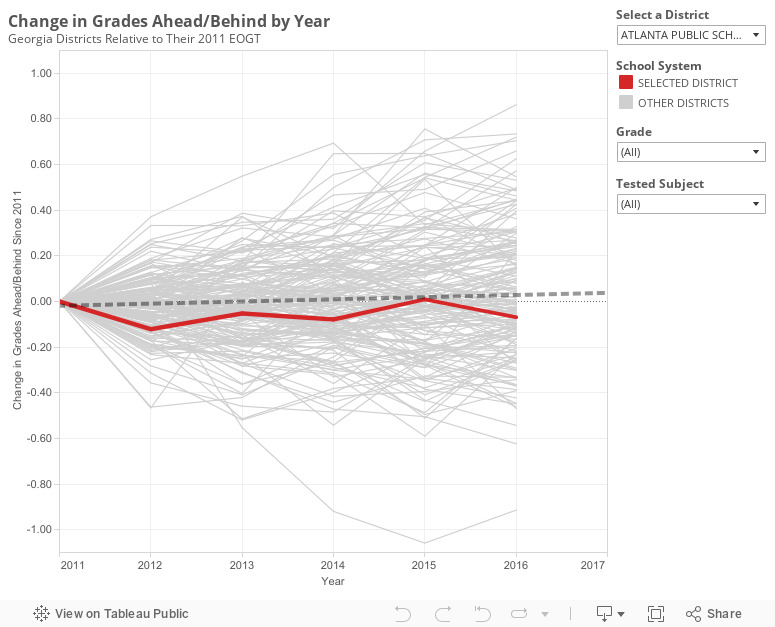
It is worth pointing out that movement in a district’s scores on this graph may not solely reflect changes in quality. For example, if a district is rapidly gentrifying (e.g. Decatur City Schools), we would expect the scores to rise holding quality constant. The same is true on the flip side.
APS has gentrified slightly (meaning this graph is probably a bit generous if interpreted as a tracker for quality over time), but on the whole these demographic changes are at the margins. APS today only looks slightly different than it did in 2011. It is worth keeping this fact in mind, however, if you want to use the tool to look at other districts that may be changing more rapidly. There is also some amount of noise from year to year in small districts simply due to having fewer tested students.
Graduation
Five years ago, the state moved to a new method of tracking graduation rates. The new method means that to get an accurate graduation rate, it is important for districts to keep track of their students all through high school. When the change was first implemented graduation rates fell significantly statewide. Since that time, districts have been doing a better job of keeping paperwork on students who leave school, and as a result the rate has risen.
Graduation rates over the past five years in APS have followed a pattern similar to other Georgia districts that began around the same spot: they fell with the new method and have since increased some. Central cities Savannah, Augusta, and Macon saw rates rise a little more. Dekalb and Clayton saw rates rise a little less.
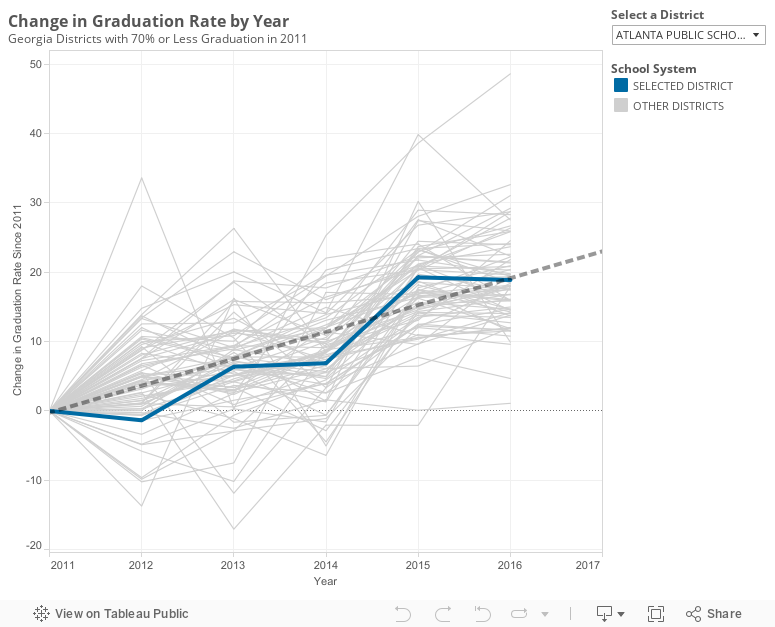
In addition to keeping better paperwork, it is possible that districts statewide are all improving in meaningful ways, though I am somewhat skeptical that Georgia school quality is widely changing. If indeed it is, APS seems to be keeping pace with others in the state rather than improving graduation more rapidly than would be expected. The district is right on the expectation line for 2016.
Does this mean district reforms aren’t working?
Not necessarily. It may be that the reforms are improving district fundamentals. For example, if the HR team is doing a better job, it takes time for that to meaningfully impact the average teacher/principal quality. Perhaps future achievement will rise. However, there is not good evidence that activities over the past 5 years have improved outcomes yet.
It is also helpful to remember that there is a lag between implementing a plan and seeing results. The district adopted a turnaround plan last spring. The plan represents the most concrete initiatives Superintendent Carstarphen has put forth in her effort to improve schools. I wrote at the time about some reasons to be optimistic the plan may succeed. The data available today doesn’t reflect that plan yet. Instead, the first real evidence of the turnaround’s impact will be available in summer 2017.
Notes:
[1] The estimated effect size of a year of schooling in grades 3-8 is about 0.37 standard deviations. The STATA code and data used in this analysis can be downloaded here.
[2] A great Upshot article found the average APS student was one grade level behind. A difference here is that grade levels are relative to the average Georgia student rather than the average student in the nation.
Keep up the good work
ReplyDelete