Saturday, July 28, 2018

Five Questions and Answers on the 2018 GA Milestones

It’s Georgia Milestones scores time again!  I always look forward to the state releasing scores on the annual exams.  It gives a good reason to check in on whether different initiatives are having their intended effect.  As I explained a few years ago, the score releases have so many numbers and are hard enough to interpret that they tend to provide lots of fodder for misguided newspaper headlines, tweets, and emoji high-fives.  In general, the conversation overstates how much fundamentals in a district or school change from one year to the next.    

Below I’ve tried to take a relatively rigorous look at five questions that interest me about Atlanta Public Schools.

It’s worth caveating that all the comments below are based on test scores.  If you believe test scores are effective measures of what we want schools to teach students, you may find these conclusions useful.  If not, nothing below will likely be of interest to you because this is about the Georgia Milestones.


      1. Has achievement in Atlanta Public Schools (APS) changed?

Not really. 

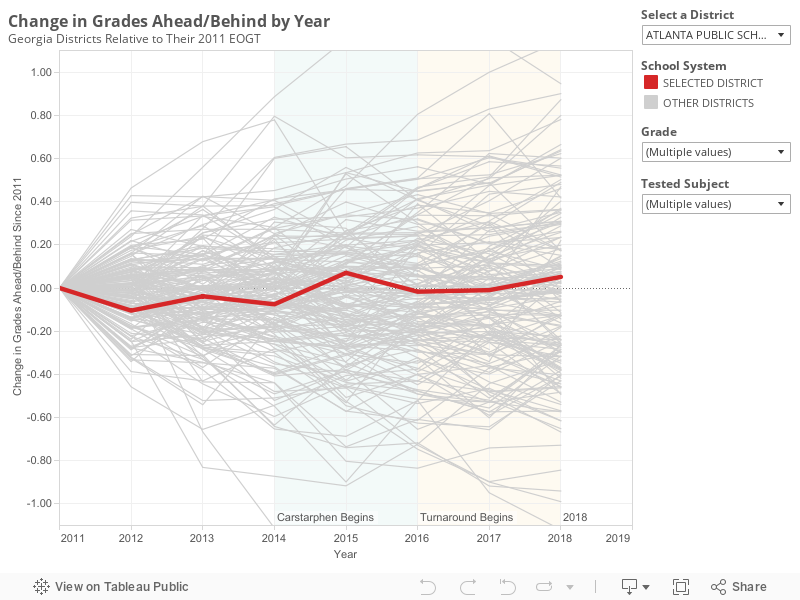
For each of the past seven years, APS has performed similarly relative to the state.  Back in 2011, the average student in the district scored 0.62 grade levels behind the state.  In 2018, the average student scored 0.55 grade levels behind the state.  The highest score occurred in 2015 and the lowest in 2012.

In general, district scores jump around a bit from one year to the next.  The graph below shows how changes in APS scores compare to changes for all the other districts in the state.  From this graph it becomes clear that what's remarkable about APS is how little scores have moved.

One reason APS scores haven’t moved much is that it’s a large district.  Small districts tend to see more variation in their scores from one year to the next.  However the stability in APS scores is noticeable even relative to similarly sized districts.  Among large metro districts, Fulton, Gwinnett, Cobb, Clayton and Forsyth all saw score changes that were more substantial than those in APS (both up and down).

A second reason that APS scores haven’t changed much is that the needs of students served by the district remain relatively stable.  The district is slowly gentrifying.  Over the past 4 years, APS has produced a consistent measure of needs for test takers in the district.[i]  That measure is called the challenge index and you can read more about it here.  It fell slightly from 60 to 58 over the past four years.

Overall, performance in APS is about the same.  It has perhaps ticked up very slightly, and its students have become slightly less needy, but overall the changes are incredibly modest.


      2. Is achievement in APS more equitable than it used to be?

No.

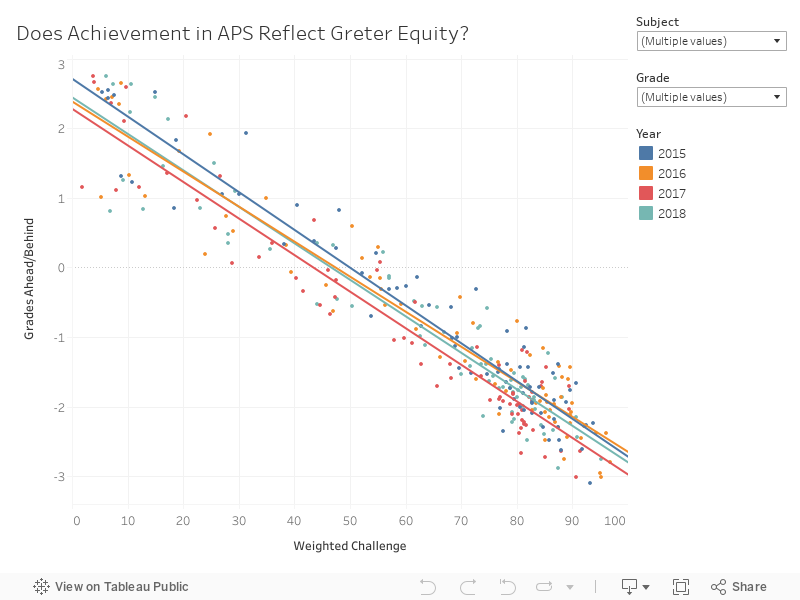
Outcomes in APS are not more equitable today than they were a few years ago.  Across the country, huge gaps exist between poor students and their wealthier peers.  For the nation as a whole, students at the wealthiest schools score about 6 grade levels above students at the poorest schools.

Consider the graph below.  A perfectly equitable district would expect to see student outcomes be independent of how wealthy or poor a school is.  In APS, the slope is similar to the country as a whole.  The slope has not changed over the past few years.

Equity in the district is about the same as it has been.


      3. Are the turnaround partnerships increasing achievement?

Possibly.

APS launched a turnaround plan a few years ago.  One component of the plan transfers management of 6 district schools to charter operators (Purpose Built, Kindezi, and KIPP).  The partnerships are being phased in over several years.  Results are available now to allow us to look at the 2016 and 2017 partnerships to see how they’ve done.

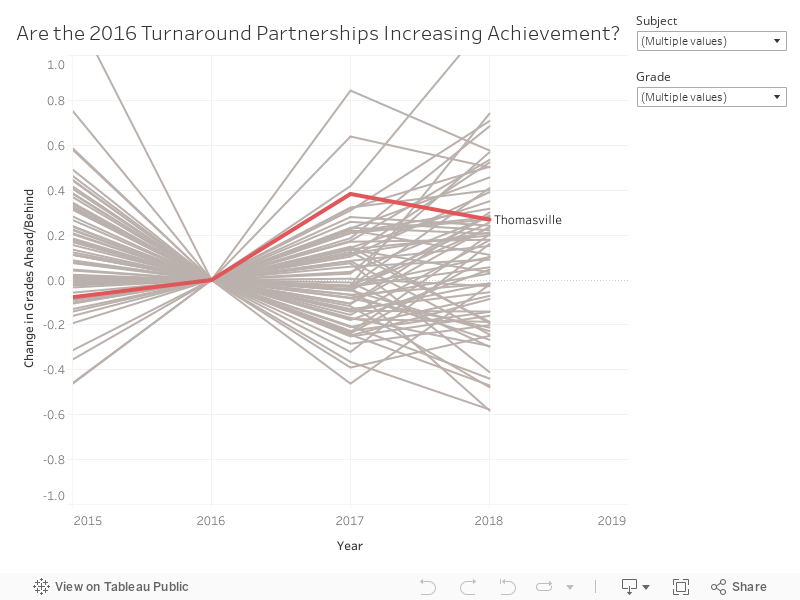
One way to analyze the impact of these partnerships is to look at how the schools were doing before the partnership and compare that to how they are doing after the partnership.  The graph below does that for Thomasville Heights, the only partnership rolled out in the fall of 2016.    

The results show that scores at Thomasville were 0.4 and 0.3 grade levels higher in 2017 and 2018, respectively, than they were in 2016, the last year before the partnership.  This is encouraging, but scores at schools change for all kinds of reasons, so its helpful to think about how these changes compare to other schools in the district (shown in grey).  We can’t say for sure that changes from one year to the next aren’t just noise unless we see that the changes are outside of the normal range that schools experience.

The change from 2016 to 2017 is greater than the change that occurred for 96% of other APS schools.  The change from 2016 to 2018 is greater than the change that occurred for 70% of other APS schools.  So, I would say that the best evidence is that the turnaround at Thomasville has had a positive impact, but the improvements are not so dramatic that they are unheard of.  For example, Burgess (a traditional public school) saw scores rise faster. 

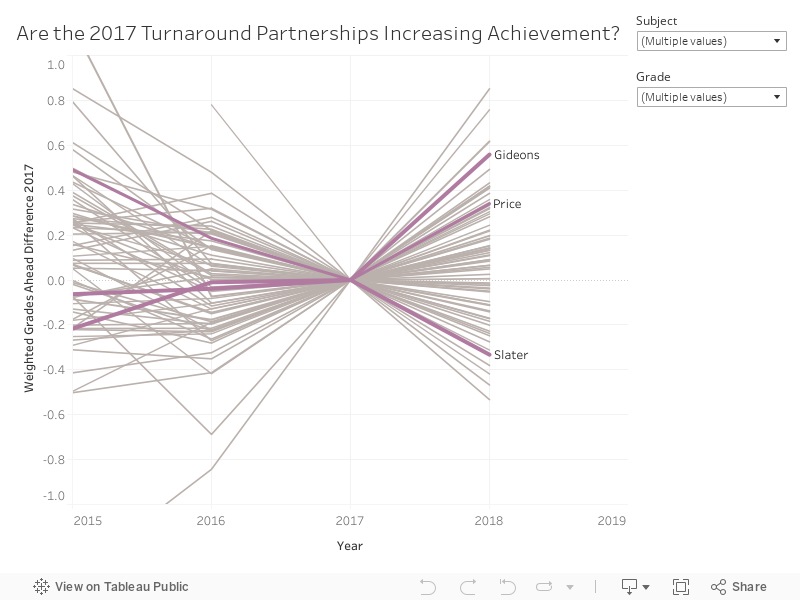
In the fall of 2017, three additional partnerships began at Gideons, Slater, and Price.  A similar analysis is shown for these schools below.  Two saw scores improve, while one saw scores decline.  The greatest increase was at Gideons.  Scores increased by 0.6 grade levels from 2017.  This improvement was greater than 96% of APS schools.  Hope-Hill was the only traditional public school that saw a similarly large increase in scores.

One might wonder if the improvement in scores at partnership schools is driven by changing student populations.  Maybe wealthier families who would not have considered the school before are willing to give it a shot under new management.  I did the same analysis above, controlling for changes in the challenge index, and the results were consistent.  Click these links to see those analyses for 2016 and 2017 partners.


      4. Are targeted interventions increasing achievement?

Not much.

A second component of the APS turnaround strategy was to provide additional resources to several schools that had performed poorly in the past.  The plan included small-group tutoring and mentoring of principals. 

Overall, there is not much evidence that these investments are paying off.  In 2017 about half the schools saw scores rise while the other half saw scores fall.  In 2018, results look a little better, but that picture doesn’t hold up once you control for changes in the challenge index.
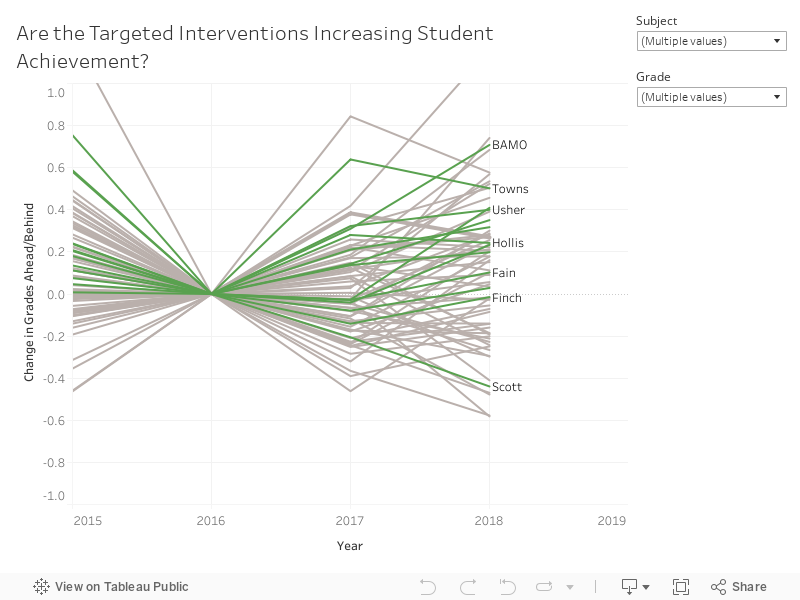

It seems like year-to-year changes at these schools may be driven by noise and school-specific things (for example leadership or staffing changes) rather than the targeted intervention strategy.  The biggest increase among the targeted schools occurred at BAMO.  The biggest decline occurred at Scott.


      5. Are charter operators beating the odds?

KIPP and Drew are.  Others are not.

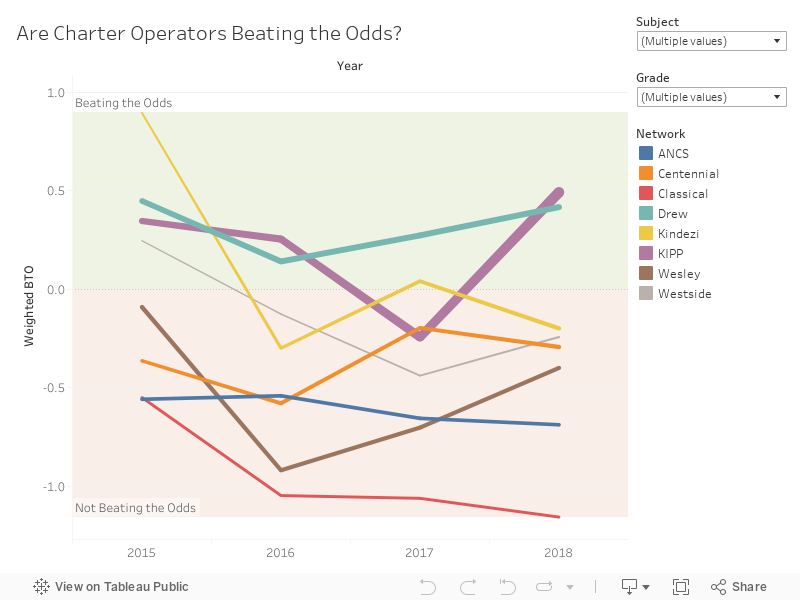
About twenty percent of APS K-8 students now attend a locally-approved charter school.  In 2018, students at KIPP scored a half a grade level above what would be expected of them based on the needs of the students who attend.  Drew students also performed better than would be expected by 0.4 grade levels.

All other charter operators performed worse than would be expected based on the students who attend.  The worst performance occurred at Atlanta Classical.  Students at that school scored 1.2 grade levels behind what would be expected.  In math skills, which are often thought to change more with school inputs, the performance was 1.8 grade levels behind.  Even though Atlanta Classical has one of the wealthiest student populations in the state, about half the schools in the state score better at math.  Students at the traditional public school, Jackson Elementary, have a similar challenge index.  However, in math, students at Jackson score 2.5 grade levels ahead of Atlanta Classical.  

The graph below shows a history of performance by charter operator.  For some, performance has varied from year to year.  For others, it has been consistently above or below expectations. 


For more analysis and to investigate specific schools, visit APS Insights.    


[i] Before this, a different measure (Free and Reduced Lunch) was generally used.  Over time, this measure became less and less accurate due to changes in federal policy, so districts and researchers moved toward measuring student needs in more accurate ways.

Tuesday, April 10, 2018

2017 NAEP Data

Today, scores were released on the 2017 National Assessment of Education Progress (NAEP), an exam that is administered to randomly selected students in states and large cities around the US.

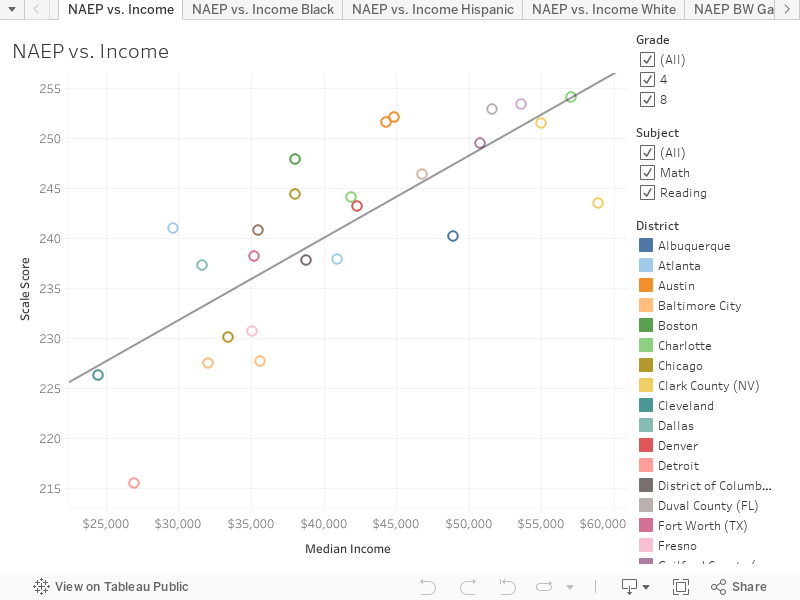
Students in Charlotte, NC scored the highest while students in Detroit scored the lowest.  Without considering income differences, the raw scores are essentially useless as measures of school quality across cities.

In Charlotte, the typical student has parents who earn $57k a year.  In Detroit, the typical student has parents who earn $27k a year.  So, it isn't at all surprising that Charlotte would score higher than Detroit, even if we knew nothing about the school quality in these cities.  Unfortunately, much of the coverage of the NAEP scores leaves out this context.

Below are 2017 NAEP scores plotted against median income for parents of students attending school in the district.  Differences in median income explain 61% of the variation in scores on the NAEP.


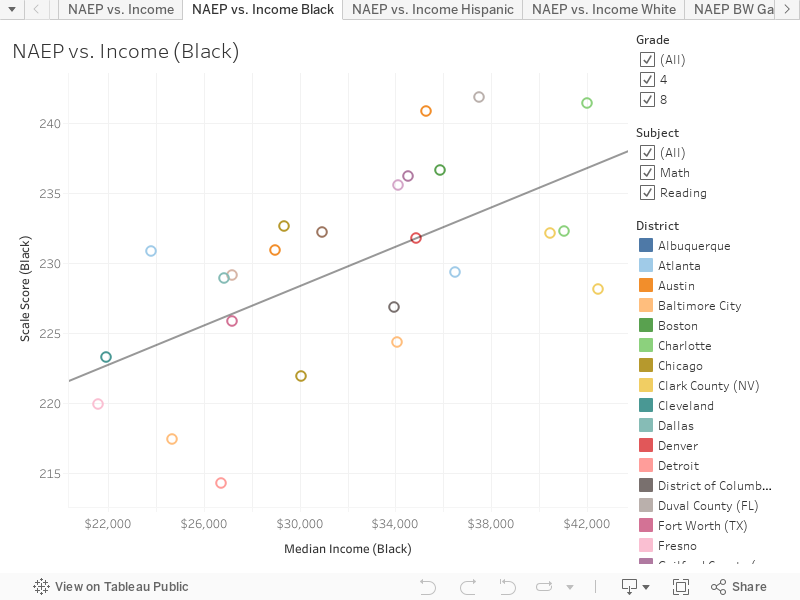
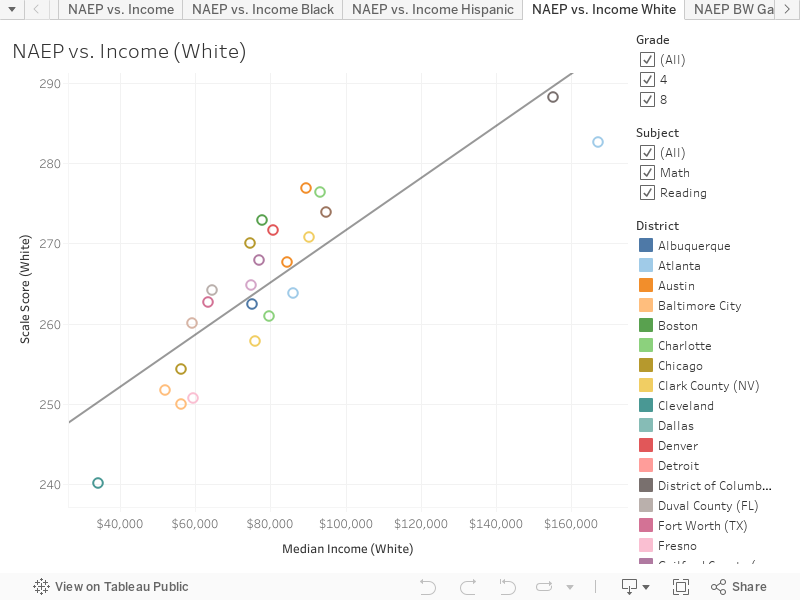
Clicking through the first four tabs of the Tableau graphic above shows that this relationship holds true within race as well.

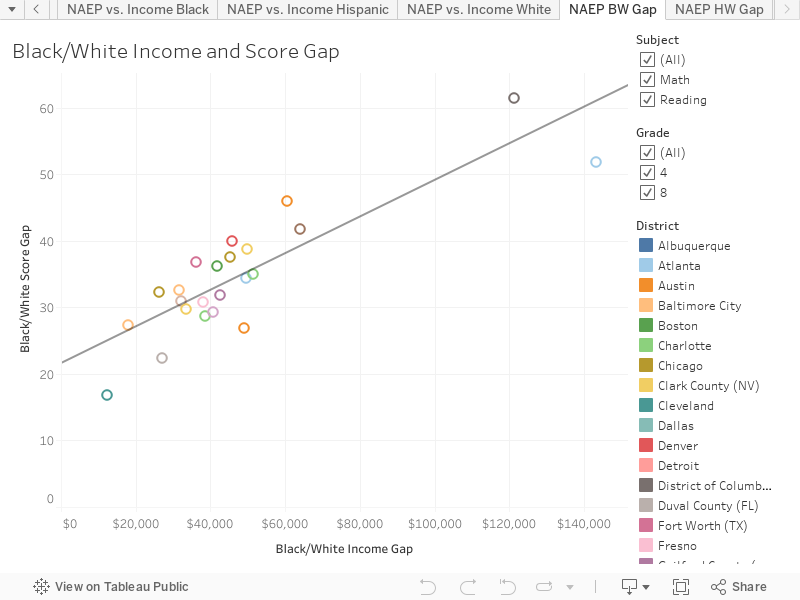
Income is also important to consider when looking at racial gaps.  An AJC article summarizing findings from the release suggested that Atlanta had a particularly large black/white gap in scores.  This is true.  It is also true that Atlanta has a particularly wide black/white gap in income.  In fact, it is the largest in the country and no city other than DC even comes close.  The typical white student in Atlanta Public Schools has parents who earn $167k.  The typical black student in Atlanta has parents who earn $24k.  So the racial gap in parent income is $143k.  No where else in the country has a gap so large.  The graph below plots this income gap along with the score gap for all cities.


Seventy-four percent of the black/white gap in average district scores is explained by the size of the income gap in the district.  Notably, the score gap in Atlanta is less than would be expected based on the income gap.

Black students in Atlanta actually score better than would be expected based on their parents' income.  Their scores are comparable to black students in Denver whose parents earn about $11k more.


White students in Atlanta score the second highest of any city in the country (DC is slightly ahead) The score is slightly below what would be expected based on their income; however, it is tough to draw many conclusions since most cities are no where close in income profile. 


The income data used above came from the Stanford Education Data Archive and is based on an American Community Survey supplement which reports data for public school and private school children.


Tuesday, February 20, 2018

HBCUs are Equally Effective at Graduating Students When Compared to Other Colleges & Universities

A team of Atlanta Journal Constitution reporters recently wrote a series of articles on Historically Black Colleges and Universities (HBCUs).  The collection tackles a wide range of topics from competition with majority-white institutions to financial troubles to claims about college effectiveness.  The articles were met with criticism by some, including Spelman College President Mary Schmidt Campbell who labeled them “a concerted and prolonged assault on HBCUs” in an open letter to the AJC Editors.

Among the authors’ assertions is a claim that the graduation rate is “a standard means of evaluating college effectiveness.”  They then discuss graduation rates at a number of HBCUs which they suggest compare unfavorably to the national average. It may be true that graduation rates are often cited when discussing college quality; however, no expert trained in education policy would assert that these are useful measures of college effectiveness.[i]

The reason for this is quite simple: colleges don’t start out with the same students.

It is almost taken for granted today in discussions of K-12 policy that it would be foolhardy to assert that differences in a school’s outcomes result from the school being more or less effective without considering characteristics of the students who attend. Because evaluations of college effectiveness are less common, it is perhaps less widely known that measures of college effectives require the same consideration to be credible.

Yale has a graduation rate of 98% while the University of West Georgia has a graduation rate of 43%.   If the 18 year olds walking on to the campuses in New Haven and Carrollton were randomly selected, it might be fair to attribute this difference to the schools’ relative effectiveness.[ii]  But no one would be willing to make such a silly assumption.  We all know that Yale freshman arrive at school with backgrounds, skills, and experiences that differ markedly from the typical student at the University of West Georgia.
    
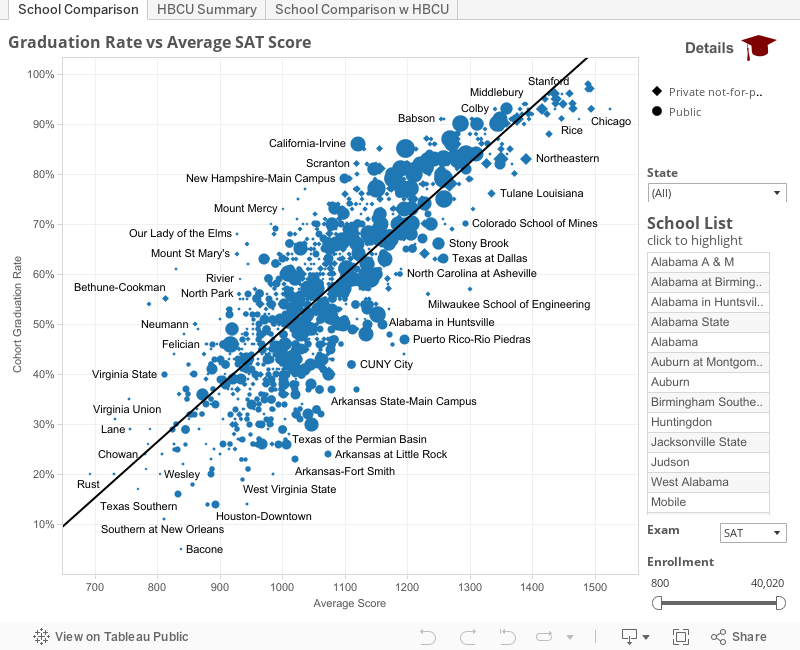
Even if we consider just one characteristic about students (the SAT score they got prior to applying to college), seventy-two percent of the variation in college graduation rates is explained.  The graph below shows the relationship between average SAT score and Cohort Graduation Rate for U.S. colleges and universities.[iii]


While some colleges graduate more students than one would expect based on average SAT score and others graduate fewer, most schools’ graduation rates are pretty well predicted by the SAT scores of the students who attend.  

For this reason, if we want to make claims about school effectiveness, we need to compare the graduation rates of schools that serve similar students.

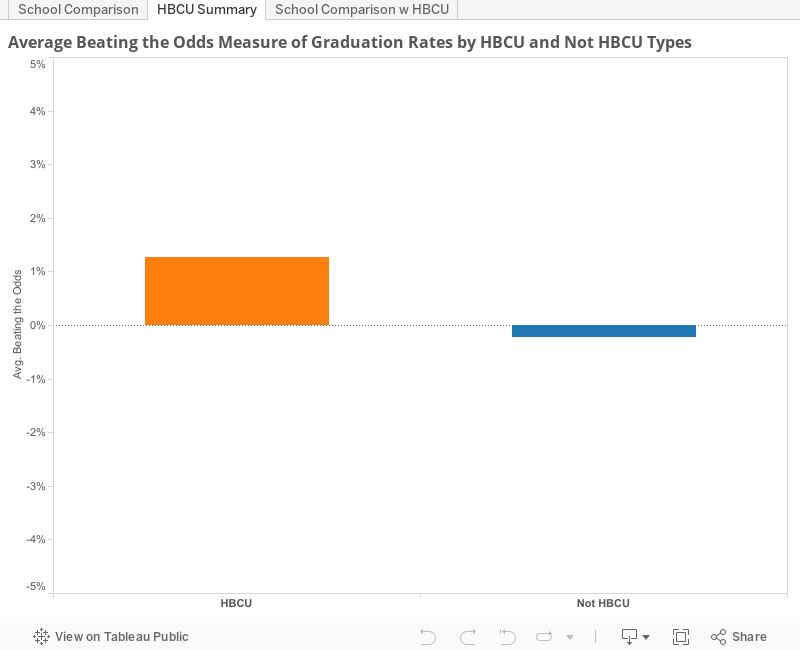
In this light, HBCU graduation rates are just about what one would expect given the students served.  In fact, the schools graduate about one percent more students than would be expected if SAT scores are used to predict graduation rates.    The graph below shows the average amount by which graduation rates exceed or fall short of expectations separated by HBCU and non HBCU schools (i.e. how much the schools are “beating the odds”).


In addition to this summary information, you can also use the graph below to look at how the graduation rates at specific schools differ from what would be expected based on students’ performance on the SAT.


It is important to remember that SAT scores are only one way that students differ from each other.  Students also differ in other ways not picked up by SAT scores (non-cognitive skills, family background, ability to pay tuition, essay writing skills, etc.).  In addition, each school has different standards for graduation.[iv]  For these reasons, the “beating the odds” measure is best interpreted with caution when attempting to measure school effectiveness.  That said, it is certainly an improvement over a comparison of graduation rates that pays no attention to which students attend.

Legitimate public policy questions remain with respect to low graduation rates at colleges and universities.  In particular, it is not clear that it is in the best interest of students to provide student loans to those whose pre-college record suggests they are very unlikely to complete their course of study, leaving them with debt but no degree.  However, this is not an HBCU-specific issue.  Once SAT scores are considered, and schools are compared to others serving similar populations, there is no evidence that HBCUs are less effective than non-HBCUs at getting their students to graduate.


Disclosure: I do research and teach Mathematical Economics at Spelman College, an Atlanta HBCU.  


[i] Graduation rates may be useful for other purposes.  For example, when seeking to hire candidates, some companies focus on schools with high graduation rates.  This choice is different in that companies do not care whether candidates gained their skills at the school or prior to enrolling.  They simply care about the total skills accumulated upon graduation.  This is quite different from using graduation rates to make claims about college effectiveness.
[ii] In some ways this would still be problematic because it means something different to graduate at one institution vs. another because standards vary from school to schoool.
[iii] This visual was adapted from work done by John Keltz for his Numbers Box blog.  Its uses 2013-14 data.  Visit the blog for more info on these schools including pell-grant eligibility and individual school profiles.
[iv] The model used to predict scores is a linear model for simplicity.  In a small number of schools at the right side of the distribution, this results in predictions that exceed the possible graduation rate of 100%.

Thursday, November 3, 2016

APS Achievement and Graduation Haven’t Changed Much

It can sometimes be tough to keep an eye on how a school or district is doing in Georgia over time. The data that gets reported changes frequently.  CRCT exams get swapped for Georgia Milestones.  Graduation rates fall when the state moves to a new method.  Graduation rates rise as districts adjust to the new method.  The state introduces CRRPI scores.  A couple of years later, CCRPI scores get calculated a new way.

All of this generates plenty of fodder for newspaper headlines, public relations campaigns, and resume bullet points, but at the end of the day it makes it tough to separate the wheat from the chaff.  What’s real and what’s noise?  Each district and school will have a different answer.  For Atlanta Public Schools, the answer is that neither achievement nor graduation has moved in very meaningful ways in recent years.

Achievement

Following the cheating scandal, scores in APS dropped as cheating teachers were fired and exams returned to reflecting true student learning.  Since 2011 though, not much has changed.

Because tests are harder in some grades/subjects than others and the Milestones have a different average score than the CRCT, it is helpful to report scores on a consistent basis when comparing one year to the next.  One way to do this is to report scores in terms of how many years ahead or behind they suggest a district is.[1] 

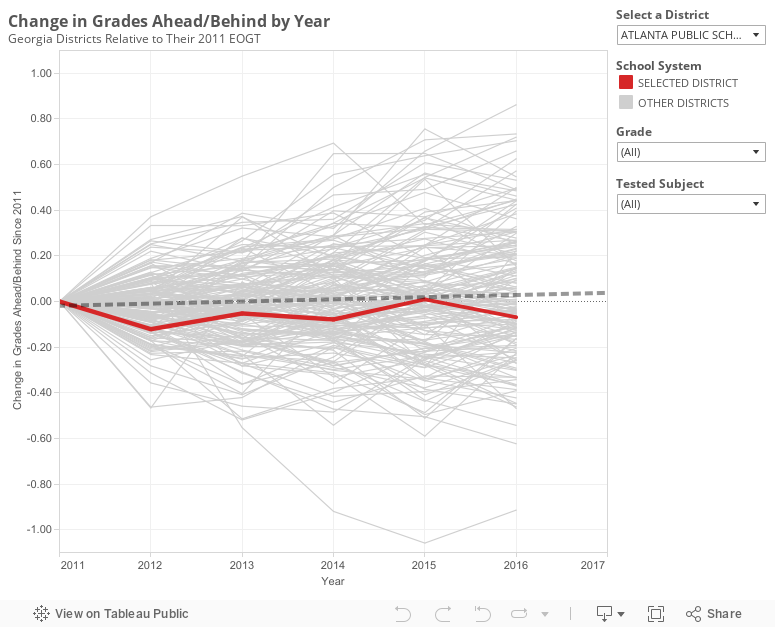
Back in 2011, APS students were about 0.62 grades behind the average student in the state.[2]  In 2016, they were about 0.69 grades behind.  Not much has changed.  The graph below shows how EOGT scores for Georgia districts have moved over the past five years.


It is worth pointing out that movement in a district’s scores on this graph may not solely reflect changes in quality.  For example, if a district is rapidly gentrifying (e.g. Decatur City Schools), we would expect the scores to rise holding quality constant.  The same is true on the flip side.

APS has gentrified slightly (meaning this graph is probably a bit generous if interpreted as a tracker for quality over time), but on the whole these demographic changes are at the margins. APS today only looks slightly different than it did in 2011.  It is worth keeping this fact in mind, however, if you want to use the tool to look at other districts that may be changing more rapidly.  There is also some amount of noise from year to year in small districts simply due to having fewer tested students.

Graduation

Five years ago, the state moved to a new method of tracking graduation rates. The new method means that to get an accurate graduation rate, it is important for districts to keep track of their students all through high school.  When the change was first implemented graduation rates fell significantly statewide.  Since that time, districts have been doing a better job of keeping paperwork on students who leave school, and as a result the rate has risen.

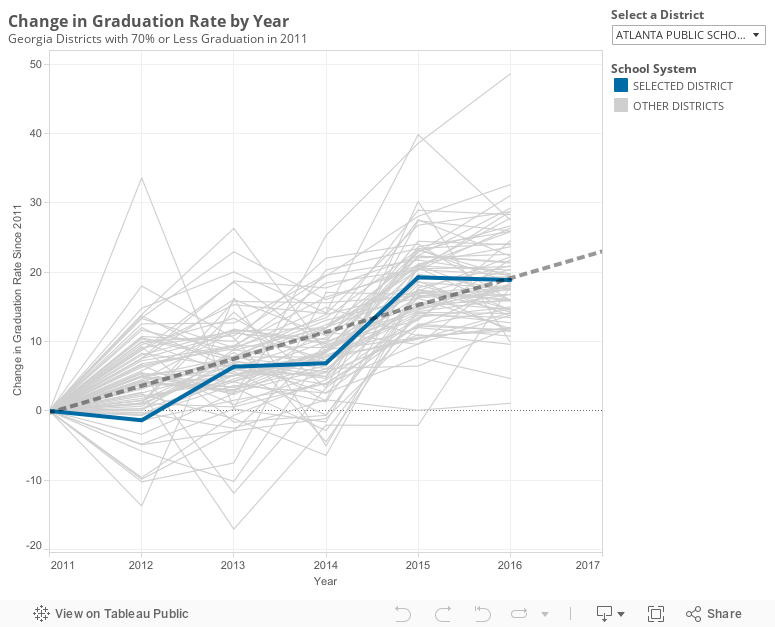
Graduation rates over the past five years in APS have followed a pattern similar to other Georgia districts that began around the same spot: they fell with the new method and have since increased some.  Central cities Savannah, Augusta, and Macon saw rates rise a little more.  Dekalb and Clayton saw rates rise a little less.


In addition to keeping better paperwork, it is possible that districts statewide are all improving in meaningful ways, though I am somewhat skeptical that Georgia school quality is widely changing.  If indeed it is, APS seems to be keeping pace with others in the state rather than improving graduation more rapidly than would be expected.  The district is right on the expectation line for 2016.

Does this mean district reforms aren’t working?  

Not necessarily.  It may be that the reforms are improving district fundamentals.  For example, if the HR team is doing a better job, it takes time for that to meaningfully impact the average teacher/principal quality.  Perhaps future achievement will rise.  However, there is not good evidence that activities over the past 5 years have improved outcomes yet.

It is also helpful to remember that there is a lag between implementing a plan and seeing results. The district adopted a turnaround plan last spring.  The plan represents the most concrete initiatives Superintendent Carstarphen has put forth in her effort to improve schools.  I wrote at the time about some reasons to be optimistic the plan may succeed.  The data available today doesn’t reflect that plan yet.  Instead, the first real evidence of the turnaround’s impact will be available in summer 2017.  

Notes:
[1] The estimated effect size of a year of schooling in grades 3-8 is about 0.37 standard deviations.  The STATA code and data used in this analysis can be downloaded here.
[2] A great Upshot article found the average APS student was one grade level behind.  A difference here is that grade levels are relative to the average Georgia student rather than the average student in the nation.