Last year, I used Georgia Milestones data to analyze performance and answer five questions that interest me about Atlanta Public Schools. I find it helpful to use consistent metrics over time, so below I have tried to answer the same questions this year, using the same approaches.
Overall, things look similar to the conclusions I reached a year ago.
Overall, things look similar to the conclusions I reached a year ago.
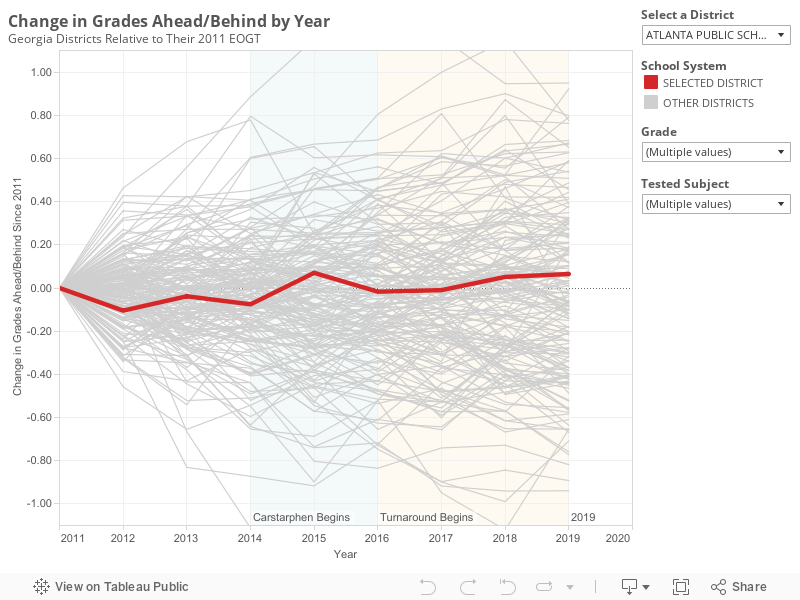
1. Has achievement in Atlanta Public Schools (APS) changed?
Not really.
For each of the past eight years, APS has performed similarly relative to the state. Back in 2011, the average student in the district scored 0.62 grade levels behind the state. In 2019, the average student scored 0.54 grade levels behind the state. The highest score occurred in 2015 and the lowest in 2012.
Compared to a year ago, scores went up by 0.01 grade levels.
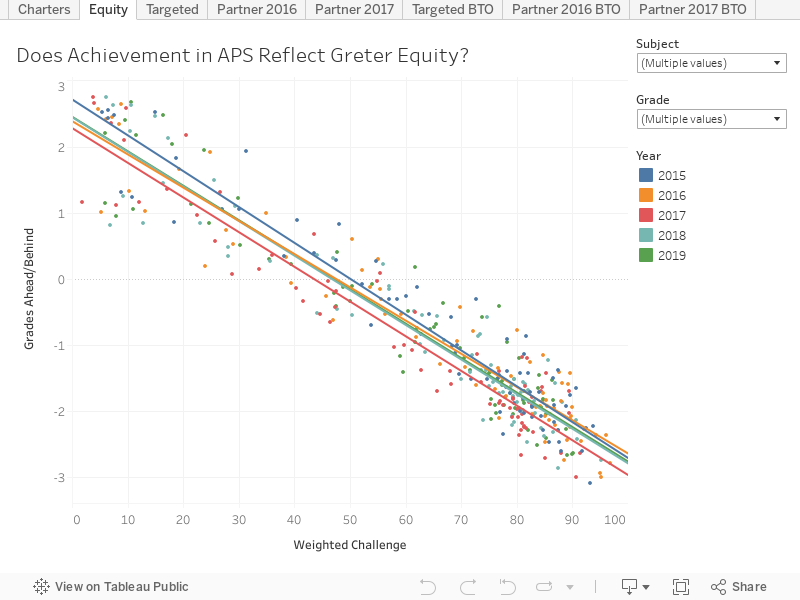
2. Is achievement in APS more equitable than it used to be?
No.
Outcomes in APS are not more equitable today than they were a few years ago. Across the country, huge gaps exist between poor students and their wealthier peers. For the nation as a whole, students at the wealthiest schools score about 6 grade levels above students at the poorest schools.
Consider the graph below. A perfectly equitable district would expect to see student outcomes be independent of how wealthy or poor a school is. In APS, the slope is similar to the country as a whole. The slope has not changed over the past few years.
Equity in the district is about the same as it has been.
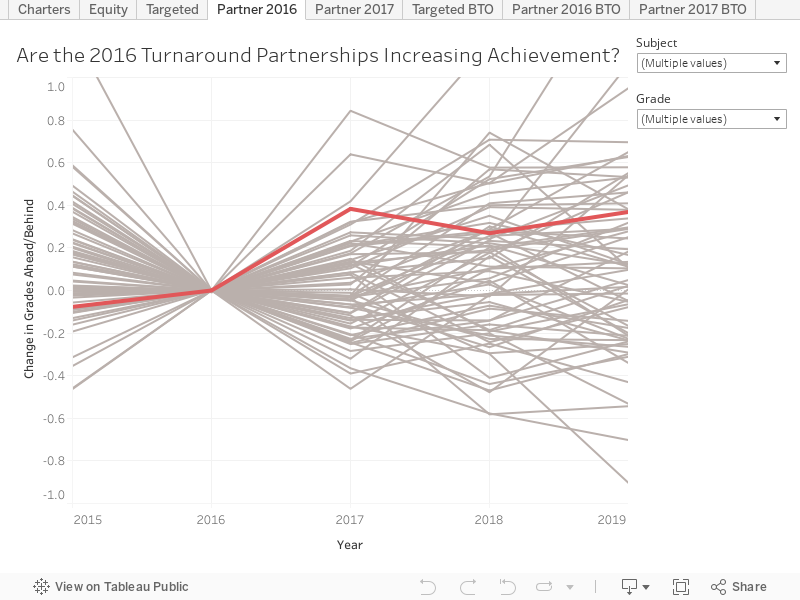
3. Are the turnaround partnerships increasing achievement?
On average, they seem to be, though not all are.
APS launched a turnaround plan a few years ago. One component of the plan transfers management of 6 district schools to charter operators (Purpose Built, Kindezi, and KIPP). The partnerships are being phased in over several years. Results are available now to allow us to look at the 2016 and 2017 partnerships to see how they’ve done.
One way to analyze the impact of these partnerships is to look at how the schools were doing before the partnership and compare that to how they are doing after the partnership. The graph below does that for Thomasville Heights, the only partnership rolled out in the fall of 2016.
The results show that scores at Thomasville were 0.4, 0.3, and 0.4 grade levels higher in 2017, 2018, and 2019, respectively, than they were in 2016, the last year before the partnership. Overall the results suggest a bump in the first year that has been maintained. However, scores have not continued to rise much as students in the school are exposed to additional years of the intervention.
In the fall of 2017, three additional partnerships began at Gideons, Slater, and Price. A similar analysis is shown for these schools below. Two saw scores improve, while one saw scores decline. The greatest first-year increase was at Gideons. Price saw its scores rise by 0.3 grade levels in 2018 and an additional 0.3 grade levels in 2019. This overall increase is higher than 93 percent of schools in the district over the same two-year period. Slater saw its scores decrease the first year and rebound in the second year.
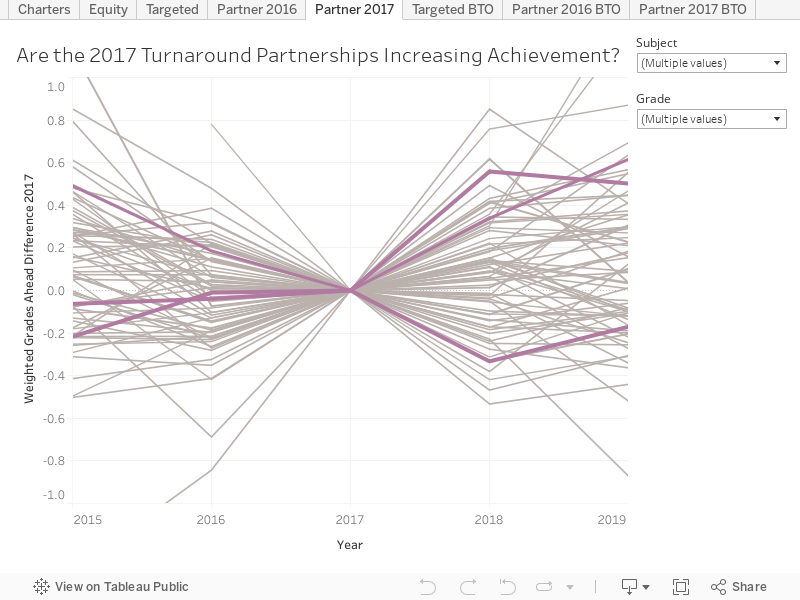
One might wonder if the improvement in scores at partnership schools is driven by changing student populations. Maybe wealthier families who would not have considered the school before are willing to give it a shot under new management. I did the same analysis above, controlling for changes in the challenge index, and the results were less favorable for Price and a bit more favorable for Slater. Click these links to see those analyses for 2016 and 2017 partners.
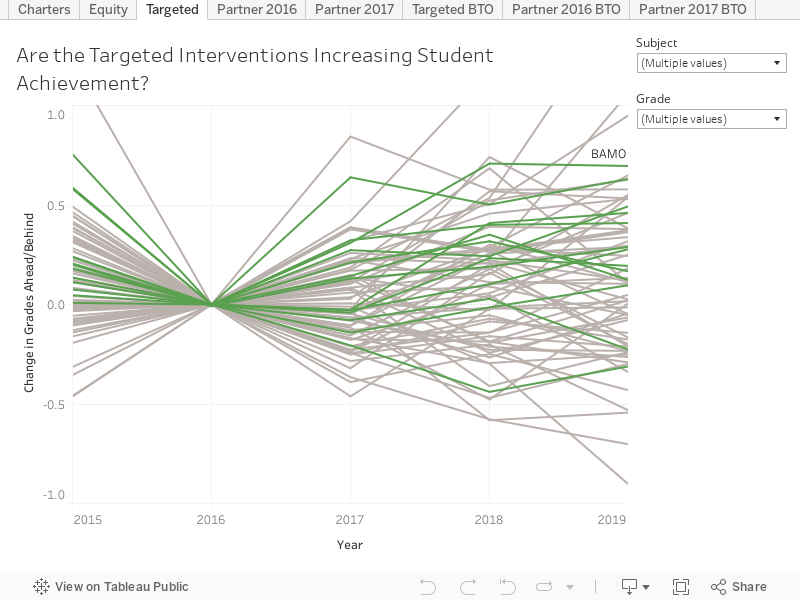
4. Are targeted interventions increasing achievement?
Performance at these schools for 2019 is 0.1 grade levels below 2015 performance and 0.2 grade levels higher than 2016 performance.
Overall, there were slightly more of these schools that improved from 2018 to 2019 than did not. Seven schools saw scores increase. Four schools saw scores decline. Two schools saw scores remain the same. If one controls for changes in the challenge index, the 2019 results show that about half the schools are up and half the schools are down from their 2016 performance prior to the intervention.
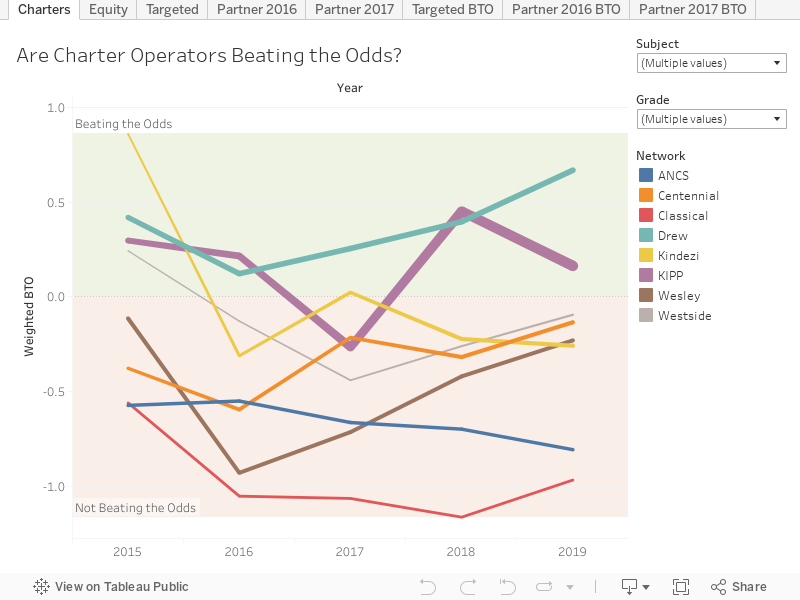
5. Are charter operators beating the odds?
KIPP and Drew are. Others are not.
About twenty percent of APS K-8 students now attend a locally-approved charter school. In 2018, students at KIPP scored 0.2 grade levels above what would be expected of them based on the needs of the students who attend. Drew students also performed better than would be expected by 0.7 grade levels.
All other charter operators performed worse than would be expected based on the students who attend. Atlanta Classical improved from the prior year, but its performance remained the worst among charters. Students at that school scored 1.0 grade level behind what would be expected. Performance in math improved substantially. Math scores matched the 2015 performance which was the highest historical year. Large gaps still remain with peer schools. Students at the traditional public school, Jackson Elementary, have a similar challenge index. However, in math, students at Jackson score 1.5 grade levels ahead of Atlanta Classical. The school would need to sustain improvements of a similar magnitude to this year for a few more years to close this gap.
The graph below shows a history of performance by charter operator. For some, performance has varied from year to year. For others, it has been consistently above or below expectations.
No comments:
Post a Comment